If you have ever put a site into PageSpeed Insights, you have met a green or orange circle with one number in it. People remember that number, but it tells the least of anything on the page.
This article explains the three metrics Google calls Core Web Vitals: what each measures, which values count as good, and how they differ from the overall score. It uses real figures from our own site, measured on 15 October 2026.
The three metrics to know
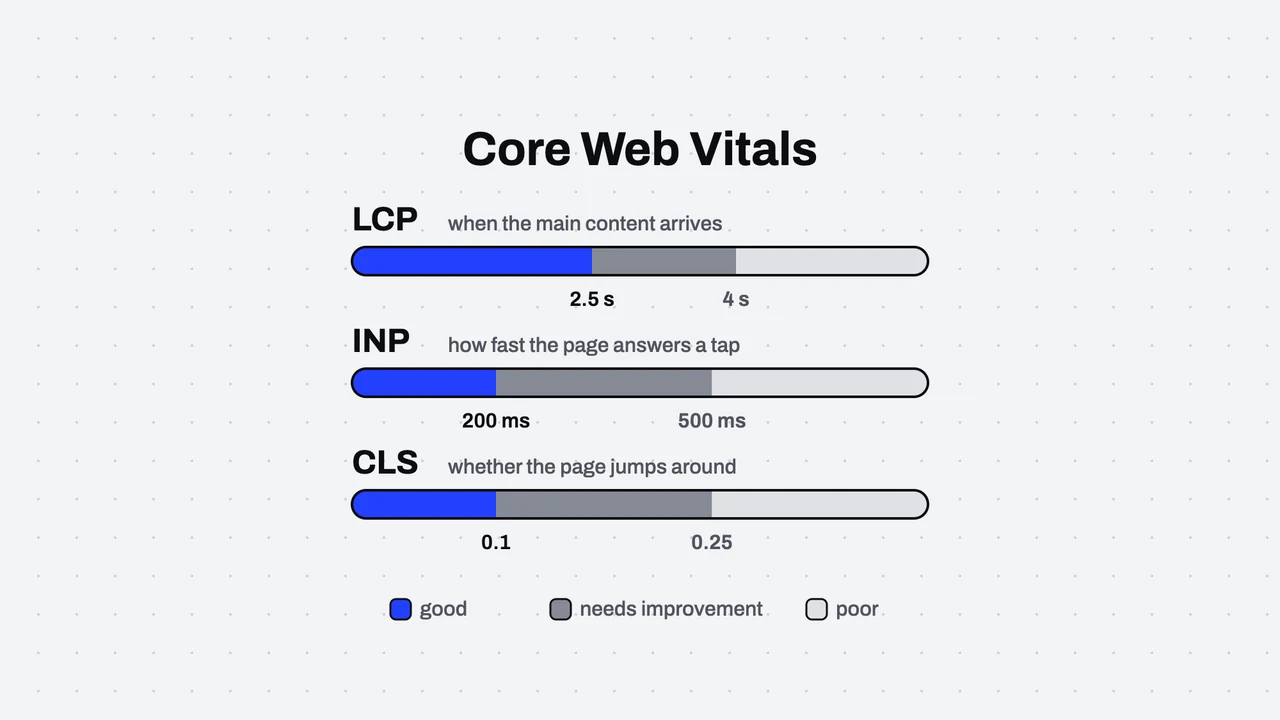
Core Web Vitals are three metrics that describe the experience of someone opening a page. Each answers one question.
LCP: when does the main content arrive
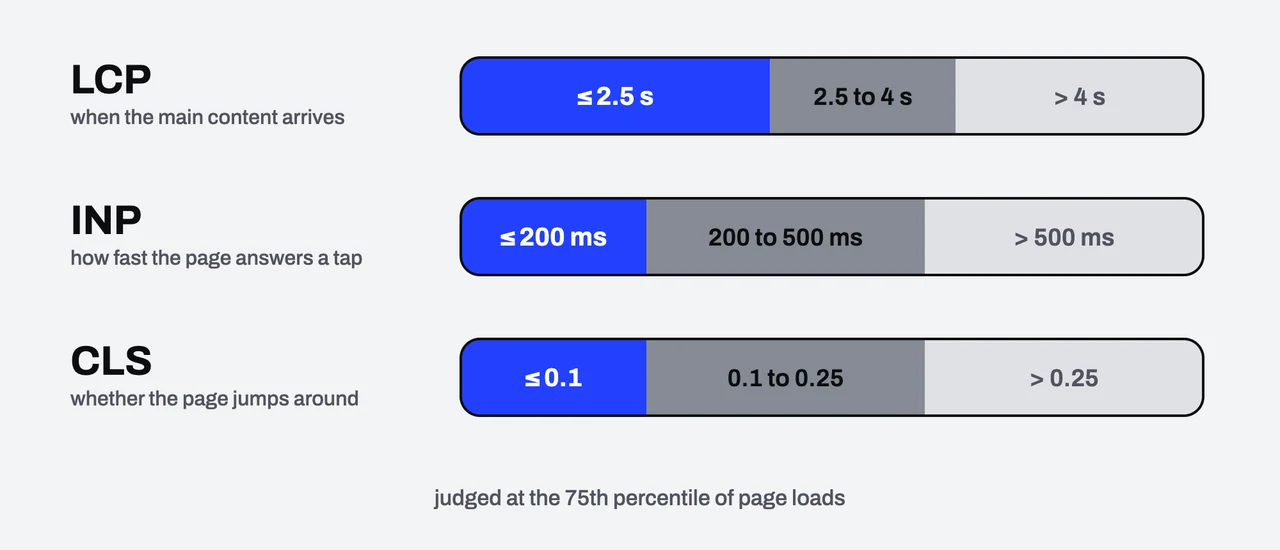
Largest Contentful Paint is the time at which the largest part of the page, usually the main image or the big headline, has been drawn. It counts as good at 2.5 seconds or less and poor beyond 4 seconds.
INP: how fast does the page answer a tap
Interaction to Next Paint measures how long you wait, after pressing a button, tapping or typing, for the page to visibly change. It counts as good at 200 milliseconds or less and poor beyond 500. It replaced FID in March 2024.
CLS: does the page move away from your finger
Cumulative Layout Shift measures how much things jump around while the page loads, for example an image with no set size pushing the text down just as you press a button. It counts as good at 0.1 or less and poor beyond 0.25. It has no unit.
Real-user data and a lab run
PageSpeed Insights shows two sets of data on one page, and they are different things.
The first is field data. It comes from the Chrome of real visitors over the past 28 days. The value that decides the verdict is the 75th percentile of visits: three in four visits have to have a good experience or better for the page to pass. A site with little traffic may have no field data at all.
The second is lab data. Lighthouse loads the page once on a simulated machine with a throttled connection and scores it. That is good for finding causes, because it can be repeated and shows what is slow, but it is not real visitors, and INP cannot be measured in a lab because nobody presses anything. A stand-in called Total Blocking Time is used instead.
The same page, different scores
On 15 October 2026 we ran Lighthouse 13.5 against this site’s home page, six runs in under two minutes. Three runs on desktop scored 74, 79 and 83. Three on mobile scored 84, 86 and 90. Same page, same code.
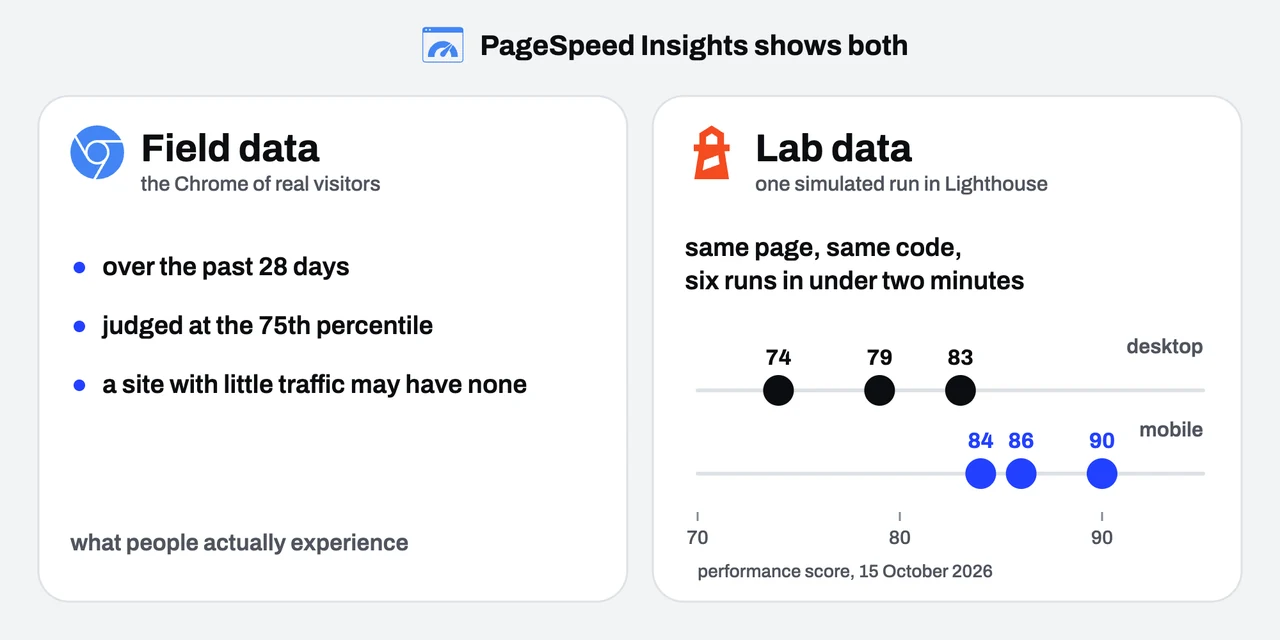
That spread is not an error. The simulated network and CPU are not identical on every run, and when LCP sits near a boundary it can cross it either way. The result is that someone quoting a single run can get a number better or worse than the truth.
We should say the rest too. In those six runs the mobile LCP in the lab was 2.8 to 3.8 seconds, which is still above the 2.5 seconds we aim for. On desktop it was 1.8 to 2.5. We know that what may help mobile is a smaller JavaScript bundle.
How to read the result so it helps
Look at the field data first, if there is any. It is what real people see, and it is what Google uses.
If you only have lab results, run them at least three times and look at the range of the score, not one number.
Open the diagnostics and see which element is the LCP, the main image or a headline, and what made it late.
Look at what shifted for CLS: an image with no size, a late font, or a banner that is injected afterwards.
Do not chase the score as the goal. Chase what the visitor feels, and the score follows.
What to ask when someone quotes you a score
Is it field data or a lab run?
Mobile or desktop, and with which simulated network?
Which page, and how many runs?
What element is the LCP of that page?
If whoever quoted the score cannot answer those four, the number is not yet data.